Richest Counties in Ohio (2026)
by Kristen Carney
Updated: February 9, 2026
Richest County in Ohio
The richest county in Ohio is Delaware County with an average household income of $166,030 as of 2024 and 226,834 people as of 2024 according to the most current Census data available (citation).
| Rank | County | Population | Average Income | Median Income |
|---|---|---|---|---|
| 1 | Delaware County | 226,834 | $166,030 | $133,540 |
| 2 | Warren County | 250,008 | $145,195 | $110,132 |
| 3 | Geauga County | 95,481 | $142,932 | $107,860 |
| 4 | Union County | 67,324 | $137,663 | $112,322 |
| 5 | Medina County | 183,660 | $119,431 | $94,968 |
| 6 | Greene County | 169,688 | $110,530 | $87,309 |
| 7 | Licking County | 181,837 | $110,408 | $84,426 |
| 8 | Fairfield County | 163,453 | $110,296 | $90,966 |
| 9 | Clermont County | 211,181 | $108,776 | $85,510 |
| 10 | Hamilton County | 830,774 | $106,643 | $72,470 |
| 11 | Ottawa County | 39,994 | $104,812 | $76,101 |
| 12 | Butler County | 392,876 | $104,738 | $81,590 |
| 13 | Franklin County | 1,333,048 | $104,358 | $75,176 |
| 14 | Madison County | 44,423 | $103,062 | $87,045 |
| 15 | Wood County | 132,064 | $102,807 | $74,216 |
| 16 | Lake County | 232,216 | $102,598 | $80,925 |
| 17 | Putnam County | 34,314 | $102,439 | $84,928 |
| 18 | Henry County | 27,567 | $101,804 | $80,099 |
| 19 | Holmes County | 44,418 | $101,211 | $76,140 |
| 20 | Summit County | 537,864 | $99,066 | $71,622 |
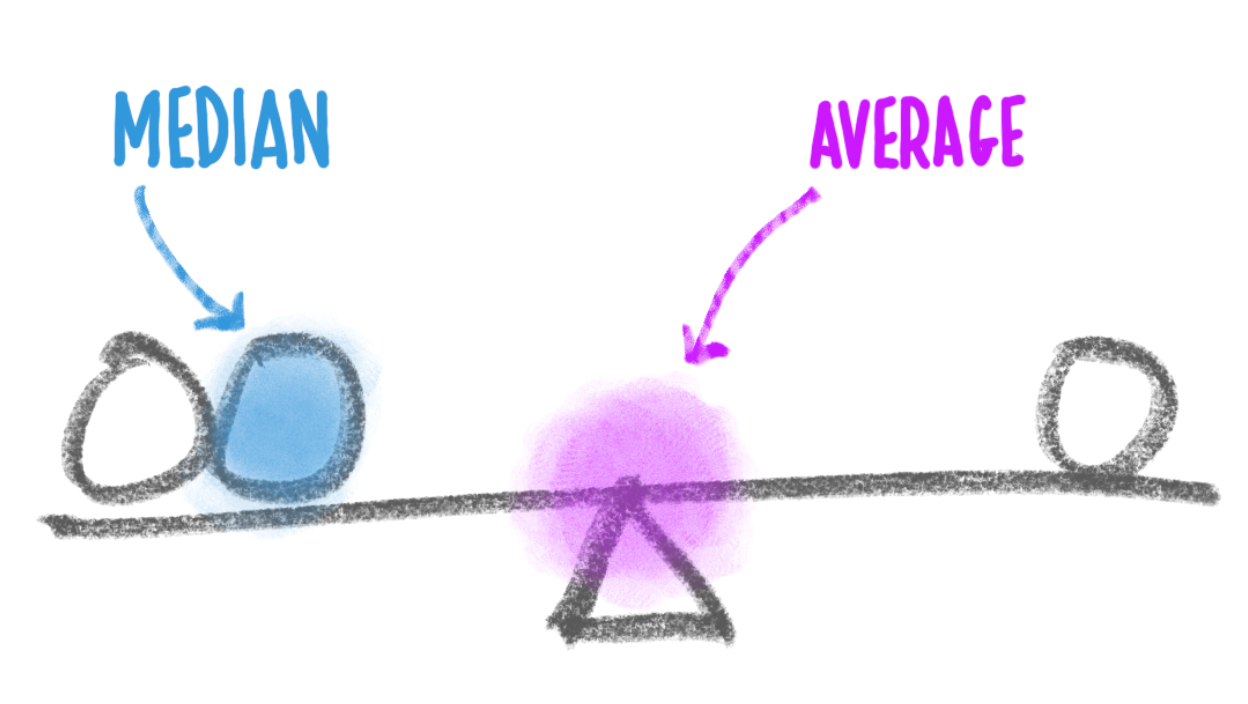
Median Income versus Average Income: Which Should You Use?
We usually suggest using median income data – either instead of or in addition to – average income data as a true indicator of wealth. If you haven’t thought about median versus average since your last standardized test, you aren’t alone. Here’s what they are:
- average is the sum of a set of numbers divided by the count of numbers in the set
- median is the middle number in the set of numbers
Now let’s say you had the following simplified set of income data.
Household 1: $30,000
Household 2: $50,000
Household 3: $1,000,000
The average income for this set is $360,000. The outlier data point ($1,000,000) skews the average WAY up. Conversely, the average income would be skewed WAY down if someone had an income of $500. The median income for the same data set is $50,000. Outlier data doesn’t skew the median.
Most Business Owners Should Use Median Income
So most business owners should use the median income as a true indicator of wealth, because it provides a more accurate representation of a typical income, especially in areas with significant income disparity.
When Should You Use Average Income
If your target market is high-income households, the average income may be more relevant. This is because the average income can highlight the presence of a higher concentration of wealthy individuals, which is beneficial for luxury goods and services marketing. We’re using average income on this page because using the Census’s highest reported median value of $250,001 could result in multiple ties for the richest geography.
Why do so many cities have a median value of $250,001?
The Census' American Community Survey uses $250,000+ as a jam value for median income estimates to protect privacy, ensure data consistency, and simplify reporting. A "jam value" in survey data refers to a placeholder or default value used when actual data points are unavailable, incomplete, or exceed certain thresholds. We represent this jam value as $250,001 to make it easy for you to sort.
You might also be interested in:
Email Me When New Data Are Released
Join thousands of subscribers and receive just 1 (ONE!) email a year in December when the US Census Bureau releases new income data for Ohio richest counties.
SOURCES
United States Census Bureau. Annual Estimates of the Resident Population: April 1, 2020 to July 1, 2024. U.S. Census Bureau, Population Division. Web. May 2025. http://www.census.gov/.
United States Census Bureau. B01001 SEX BY AGE, 2024 American Community Survey 5-Year Estimates. U.S. Census Bureau, American Community Survey Office. Web. 29 January 2026. http://www.census.gov/.
United States Census Bureau. B19013 Median Household Income, 2024 American Community Survey 5-Year Estimates. U.S. Census Bureau, American Community Survey Office. Web. 29 January 2026. http://www.census.gov/.
United States Census Bureau. “DP03 SELECTED ECONOMIC CHARACTERISTICS.” 2024 American Community Survey 5-Year Estimates. U.S. Census Bureau, American Community Survey Office. Web. 29 January 2026. http://www.census.gov/.
Products & Services
Plumbing
Connect
- 1-800-939-2130
- Contact Us
© Copyright 2026 Cubit Planning, Inc.